Web3 Fragmentation Report (vol.2): After Chain Abstraction

Table of Contents:
In June 2024, we published our first Web3 fragmentation report: the first-ever in-depth look into Web3’s most pressing problem.
In it, we demonstrated that fragmentation is rotting the industry’s core by causing massive financial, UX, incentives, and even social inefficiencies. This report also revealed that multi-chain fragmentation was a more significant issue than the industry had anticipated, costing the ecosystem billions of dollars.
In the months following its publication, chain abstraction exploded in popularity as a solution to fragmentation. And yet, the industry continued its expansion of blockchains, and both ChA and fragmentation got relegated in the industry’s low attention span by growing narratives.
One year later, we’re taking a second look at the data: we aim to provide a comprehensive, data-driven overview of how fragmentation has evolved over the past year, quantifying the increasing division of users, capital, developers, and applications across major chains. We’ll also analyze how far chain abstraction has progressed in addressing this issue, in an effort to understand how long it can take to complete its task.
Context and structure
Before diving into the data, it’s essential to note the prevailing state and narratives in the industry at the time of writing both this and our previous report. This aims to counteract Web3’s tendency to retroactively fit narratives to align with economic outcomes and to characterize everything in light of subsequent events, regardless of whether this makes sense.
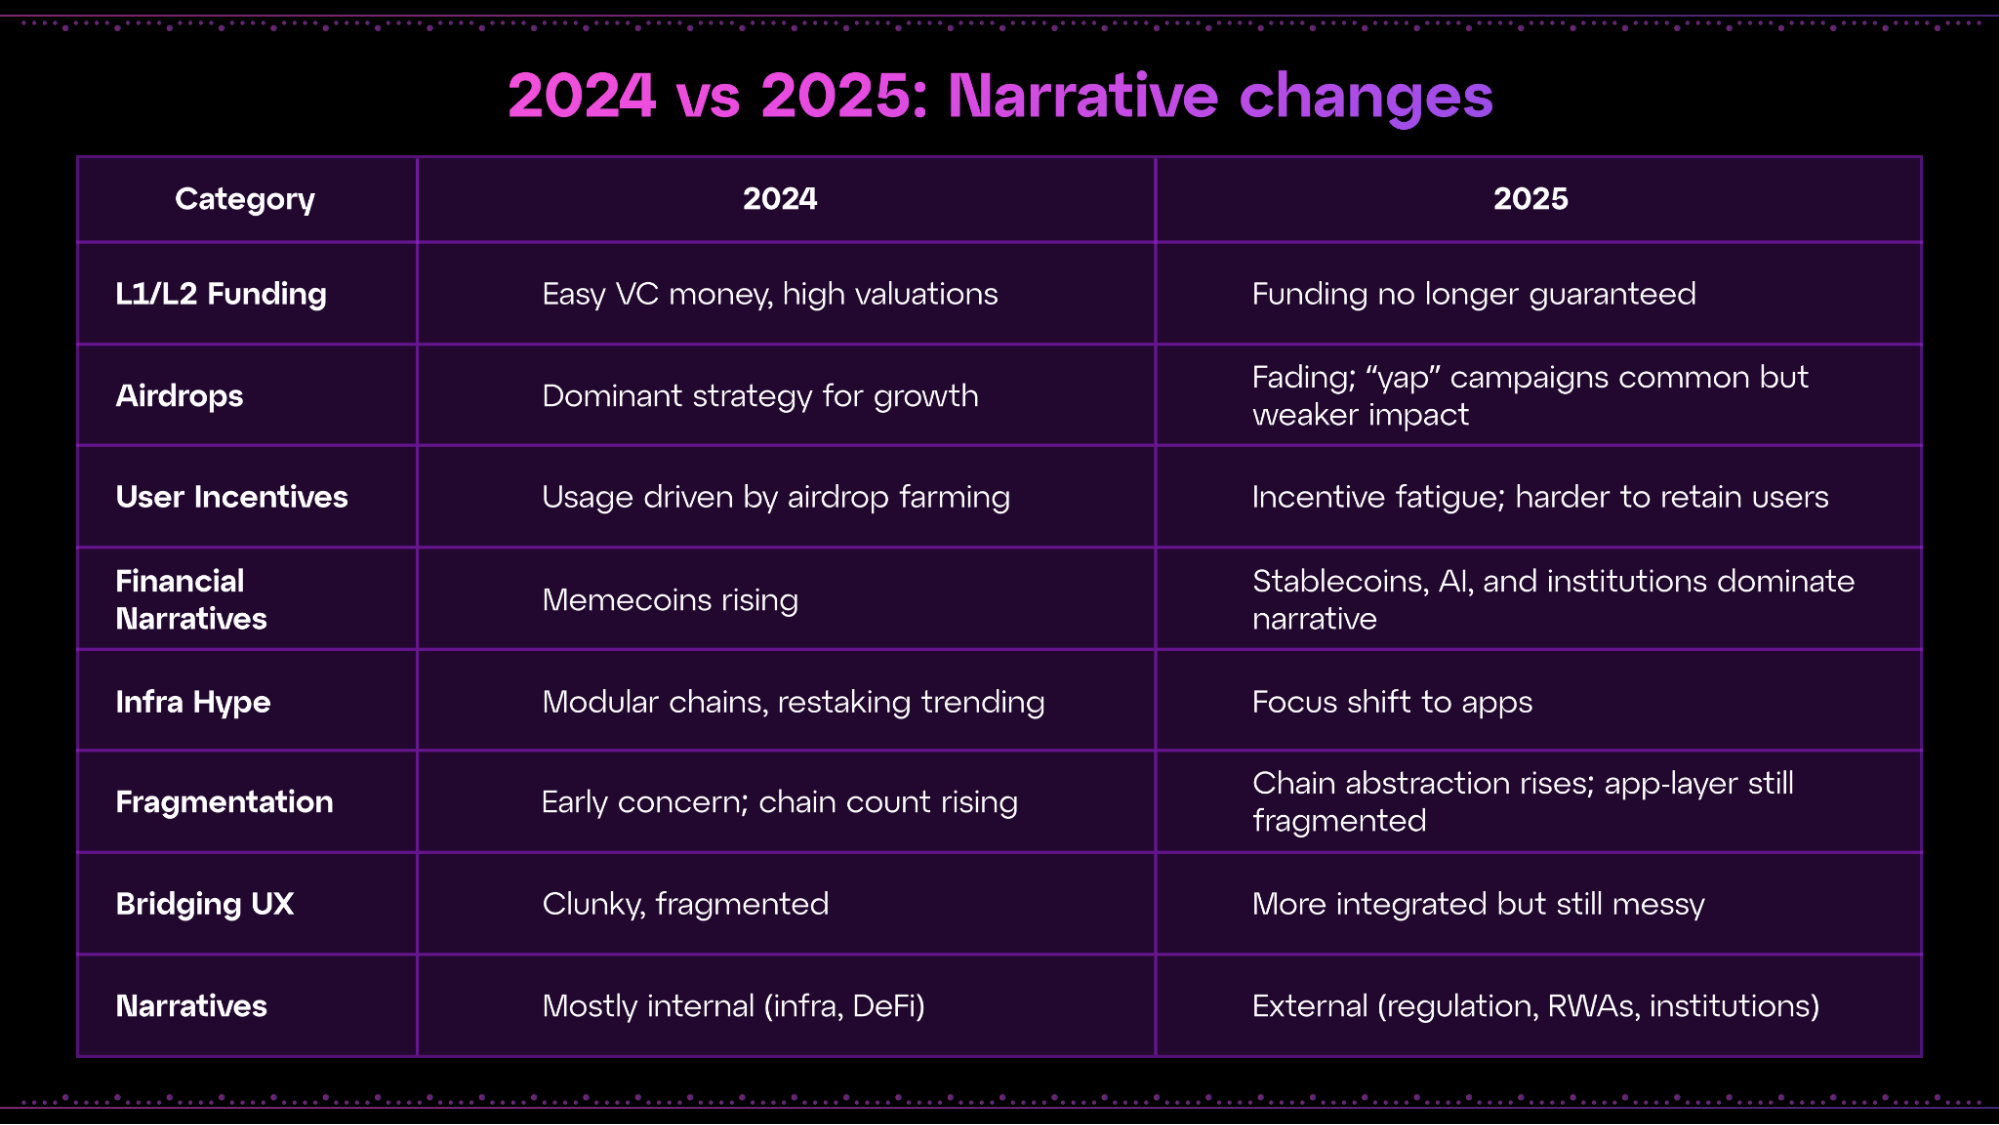
At the time of writing our 2024 report:
- VC and private capital were hyper-focused on funding L1 and L2s, with these projects easily achieving valuations in the hundreds of millions of dollars.
- Airdrop campaigns were the predominant way for projects (in particular, blockchains) to promote themselves and (even if just temporarily) drive impressive usage metrics.
- Users were heavily incentivized to use L1 and L2 apps through airdrop campaigns.
- There were visible traces of what would later become 2024’s peak memecoin mania.
- Infra narratives (modular chains, restaking) had dominated the earlier part of the year.
- The fragmentation problem was beginning to cause concerns, causing a number of projects to eventually group together under the chain abstraction Cambrian explosion of 2024.
Because of the above, at the time, we realized that the best way to understand fragmentation was through its impact on the overall ecosystem (TVLs, bridging trends, redundant development, actual usage, etc.) and its incentives (the financial motivations and opportunities driving this).
However, Web3 in 2025 works under different assumptions:
- Currently, the L2 and L1 investability is no longer a given. These projects still raise considerable funds, but they are no longer guaranteed.
- Airdrops have grown out of popularity. Although Kaito-style “yap” campaigns are still popular for projects to drive attention, remarkable onchain metrics are once again hard to drive.
- Infrastructure solutions, in general, are considered “sufficient”, and there is a growing expectation that L1s like the Ethereum Mainnet will scale on their own, as well as pressure on developers to focus on dApps.
- Bridging and cross-chain activity have become growingly integrated into application flows—although there is still much to be done in this regard, particularly as the number of chains grows.
- The saturation of blockchains has not resulted in a more distributed panorama—a handful of projects tend to reap most of the benefits (more on this, below).
- The greatest impact on Web3 is now expected to come from outside of it, in the form of positive regulation, institutional investment, and the tokenization of non-crypto assets, among others.
There is a growing lack of trust in non-financial, non-infrastructure crypto dApps’ ability to rise into the mainstream. Rather, hyped blockchain use cases default to DeFi, stablecoin, verifiability (e.g., in AI and RWAs), and security. No one is expecting Web3 Uber anymore.
Given that the incentive flow (funding -> L1s -> airdrops) is no longer a driving force of fragmentation, we can consider that fragmentation is currently a passive expansion issue, not an active force. It could also be said that, in 2025, we’re mostly living through the effects of 2024’s aggressive push—or even those of lagging solutions. The focus of this report will then be to showcase this expansion alongside the ongoing race between chain abstraction and fragmentation, and why they shouldn’t be second-tier priorities for Web3.
We’ll take four perspectives on fragmentation: those of blockchains, applications, cross-chain activity, and, of course, chain abstraction.
Blockchains: Expanding and fragmenting
Perhaps the easiest way to gain insight into the realities of fragmentation is to observe the fluctuations in DeFi TVLs on blockchains. In fact, two numbers tell us a lot here:
- In 2024, the top 5 chains accounted for around 85% of the total TVL. In 2025, they only host 80%.
- The TVL of sub-top 10 chains has gone from 10% to just under 12% over the same period, with a peak of 13.3% at fragmentation’s highest point.
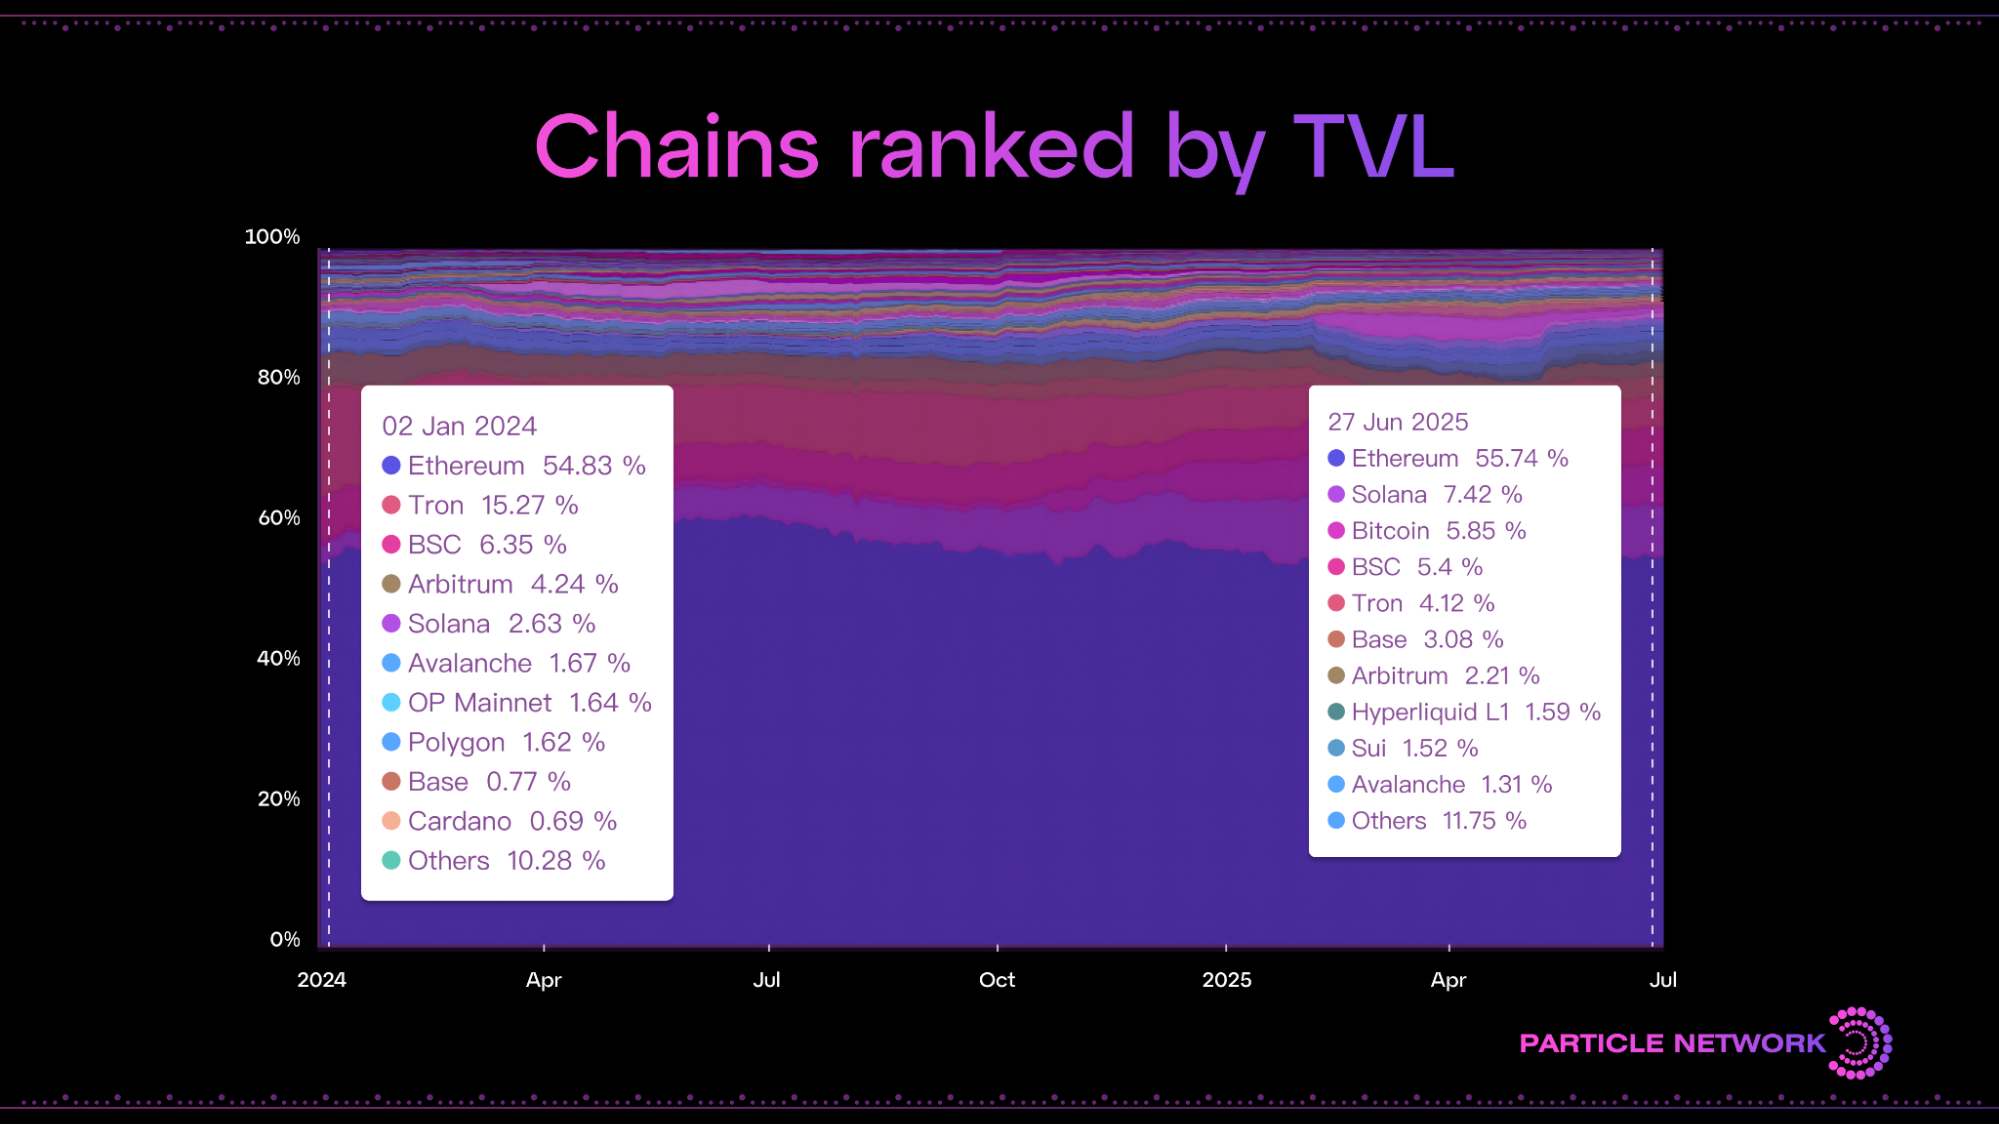
Considering there are a lot more chains in 2025 (data for that, below), we can extrapolate that:
- Fragmentation has grown, but new chains have gained very little from it. In fact, sub-top-10 chains have only managed to snatch less than 1.5% of the industry’s TVL.
- Among the top 10, equality is rising, but resulting in a worse ecosystem-wide user experience. 50% of the chains in the top 10 are incompatible between themselves, and there is no longer a dominating #2, but rather a collection of smaller players.
In conclusion, new blockchains are barely driving more traction, fragmentation is deeper, more painful to users, and liquidity spreads thinner.
But how much is Web3 expanding?
Are there really that many new chains?
It’s not only that there are more chains: They’re easier to launch than ever.
Developer tooling has made it exponentially easier to launch bespoke L1s and L2s. In our previous article, we cited that hundreds of rollups launched in 2024 alone, with every major “modular” framework showing 2‑6× chain‑count growth since 2023—most of it in 2024. Furthermore, even chain abstraction initiatives like Polygon’s AggLayer and Optimism’s Superchain, rely on the interconnection of a stack of chains. And of course, there are many early-stage, private, and unknown chains.
The following numbers paint the picture of this fragmentation and ongoing expansion:
- Optimism’s expanding Superchain ecosystem has grown to encompass 30+ chains.
- At least 159 Ethereum rollups are fully operational.
- There are 25 Avalanche L1s.
- The IBC ecosystem features over 120 blockchains, and Polkadot encompasses more than 60 appchains.
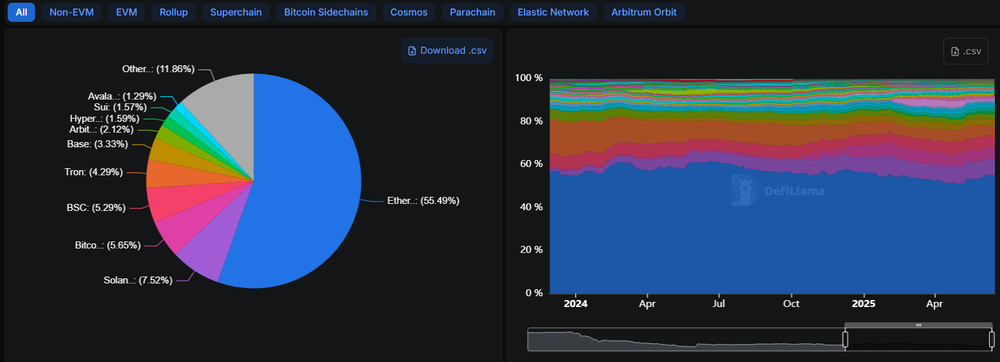
- Sites like DeFiLlama track the TVL of up to 396 blockchains.
Next, let’s examine what’s happening inside the chains to understand how fragmentation unfolds at a level even deeper than the TVL numbers suggest.
A key misalignment: Capital does not equal popularity, and vice versa
Another way to understand how fragmentation makes Web3 less efficient is by comparing the number of active users across blockchains to their utilized capital. In 2025, this problem was exacerbated, with seemingly no correlation between a chain’s TVL and its activity.
In 2025, the chains with the most users were:
- NEAR Protocol: ~2.7 million daily active addresses (+766% year-on-year), the highest of any chain, driven by a handful of successful, gamified dApps.
- Solana: ~2.6 million daily active addresses (+702% YoY), fueled by high-speed DeFi and a vibrant memecoin ecosystem. Solana has also been Web3’s volume king through the 2024-2025 period, once again showcasing that nothing is straightforward in fragmentation-land.
- TRON: ~1.9 million daily active addresses (+20% YoY), sustained by cheap stablecoin transactions (especially USDT).
- BNB Chain: ~1.0 million daily active addresses (−4.8% YoY), a slight decline, but still a major hub for DeFi and token trading.
- Polygon: ~855,000 daily active addresses (+139% YoY).
- Base: ~655,000 daily active addresses (+2,098% YoY), showing explosive growth.
- Sui: ~519,000 daily active addresses (+908% YoY), rapidly attracting users.
- Bitcoin: ~496,000 daily active addresses (−19% YoY).
- TON (The Open Network): ~414,000 daily active addresses (+5,185% YoY), spurred by its integration with Telegram’s massive user base.
- Arbitrum: ~413,000 daily active addresses (+180% YoY).
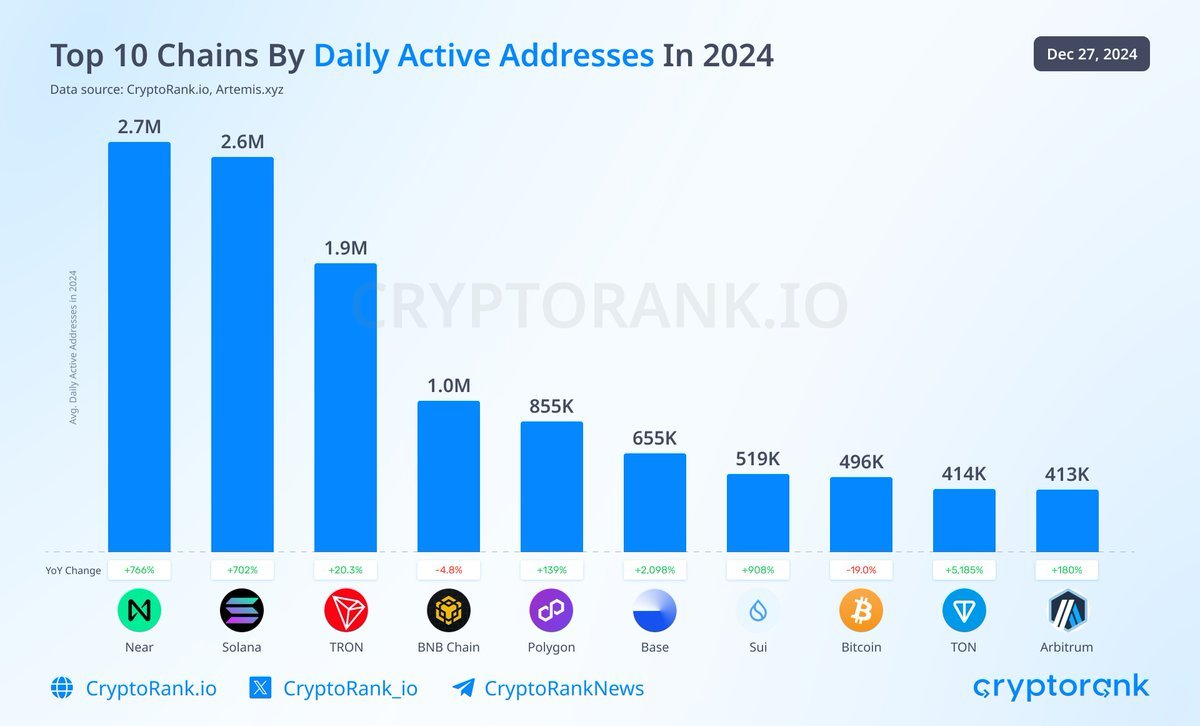
Notably, Ethereum’s Mainnet is absent from the top 10 in daily users, despite having the largest TVL. This shows that users do not equate a chain’s value (where they are more likely to park their money) with the desirability of its products—and can be deterred by high fees and other factors.
In contrast to the above, two interesting cases are Solana and NEAR. The former has raised to the industry’s top 3 by becoming its decentralized (sic) casino: a place for the fast-moving exchange of memecoins and extreme DeFi; whereas the latter has managed to achieve little notoriety despite having two of the industry’s most popular applications: Sweat Economy and Kai-ching. Yet, none of these chains has managed to surpass Tron’s former 15% TVL dominance.
This divergence highlights that no single metric can capture adoption. High user counts and even trading volume don’t always equate to high liquidity, and vice versa, illustrating that, when fragmentation is present, being the “best” blockchain is hardly enough.
…and yes, this confirms incentives have changed
As we mentioned in our previous report, a notable driver of fragmentation in recent years was the airdrop farming cycle for new L1s and L2s. Many networks launched with aggressive incentive programs to bootstrap activity, attracting swarms of users.
However, in these cases, liquidity often vanished once rewards dried up. The data above confirms what we suggested in 2024—that hyper-farmed chains (e.g. Blast) would struggle to retain a community.
2025’s dynamics seem to have reached a stalemate:
- Users can read the game: they know rewards from button-clicking dynamics are going down, and that there will always be another program somewhere else.
- Blockchains and their investors have realized this dynamic doesn’t lead to long-term value, so they invest less and less in it and aim to extract as much as possible.
- There is still, however, an incentive to launch new chains—it’s easier than ever, multiple ecosystems promise to eventually interconnect them (more on this below), and doing so enables maximum value extraction.
Welcome to 2025. Thanks for the fragmentation, 2024!
The dApps: A game stacked against builders
And, of course, as the ecosystem fragments, the attention of those building it must follow.
According to multiple reports:
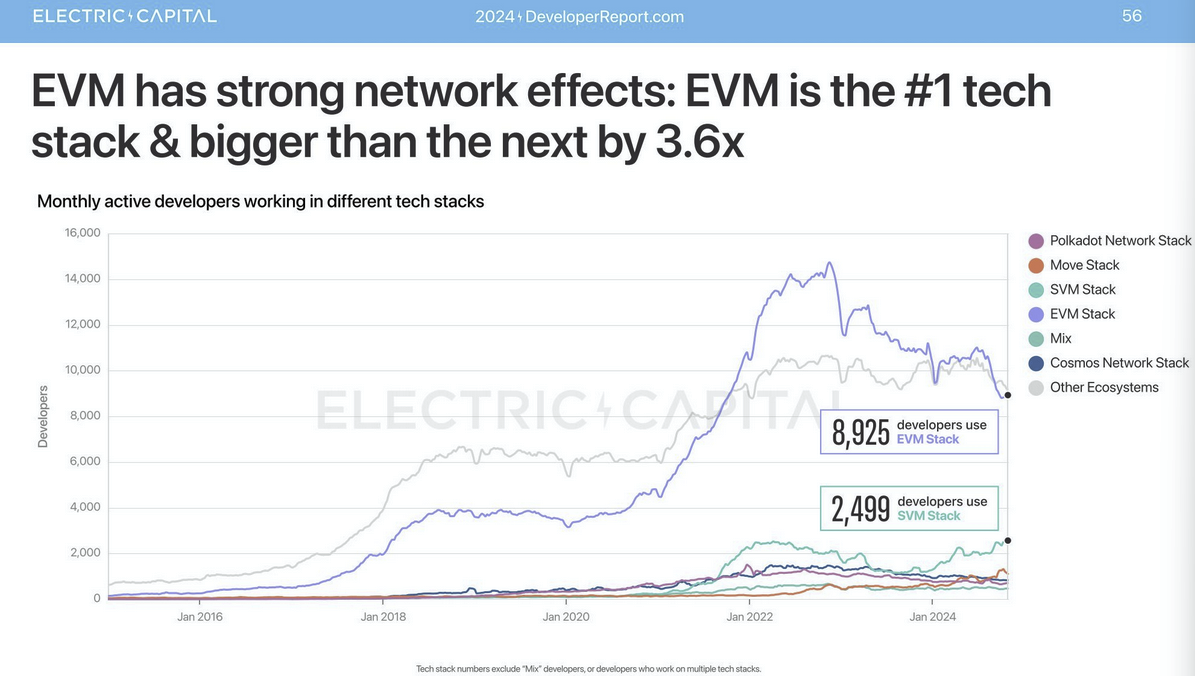
- The EVM stack remains the richest in developers, with about 8,925 monthly active developers working on it. This includes the Ethereum L1 and its EVM L2s/sidechains. This developer base is roughly 3.6× the size of its nearest competitor.
- The Solana SVM stack has grown to ~2,499 monthly developers. It notably attracted the most new developers in 2024, growing its count by ~83% year-over-year, even though the EVM stack was a close second in onboarding.
Other ecosystems also sustain hundreds of active developers: e.g., Cosmos (IBC), Near, Move-based chains (Aptos/Sui), Cardano and Bitcoin each have significant developer communities. Bitcoin has around 1,200 monthly active devs focusing on its core protocol, Lightning, ordinals, etc., a number that has stayed fairly steady.
Importantly, developers are also increasingly multi-chain in their work. Roughly 1 in 3 crypto developers now contributes to multiple ecosystems, up from <10% in 2015. This is particularly true in the EVM ecosystem, with over 56% of Ethereum developers also working on Layer-2s.
As we’ll see below, this rarely means innovation: rather, it results in duplicated efforts and inconsistent standards.
Redundancy
And of course, fragmentation hits the hardest when a user can’t assume an app they want to use is available wherever they have assets—they must go where the app is. Some projects bridge this gap by deploying on multiple chains, but that requires maintaining separate smart contracts, redundant development, and results in liquidity fragmentation.
Developers often face a choice of where to launch (which, given fragmentation, can be more important then their product choice) and if they go multi-chain, they incur extra complexity- Here, once again, we can see that popularity does not equal liquidity.
Developers often face a choice of where to launch (which, given fragmentation, can be more important than their product choice) and if they go multi-chain, they incur extra complexity. Here, once again, we can see that popularity does not equal liquidity.
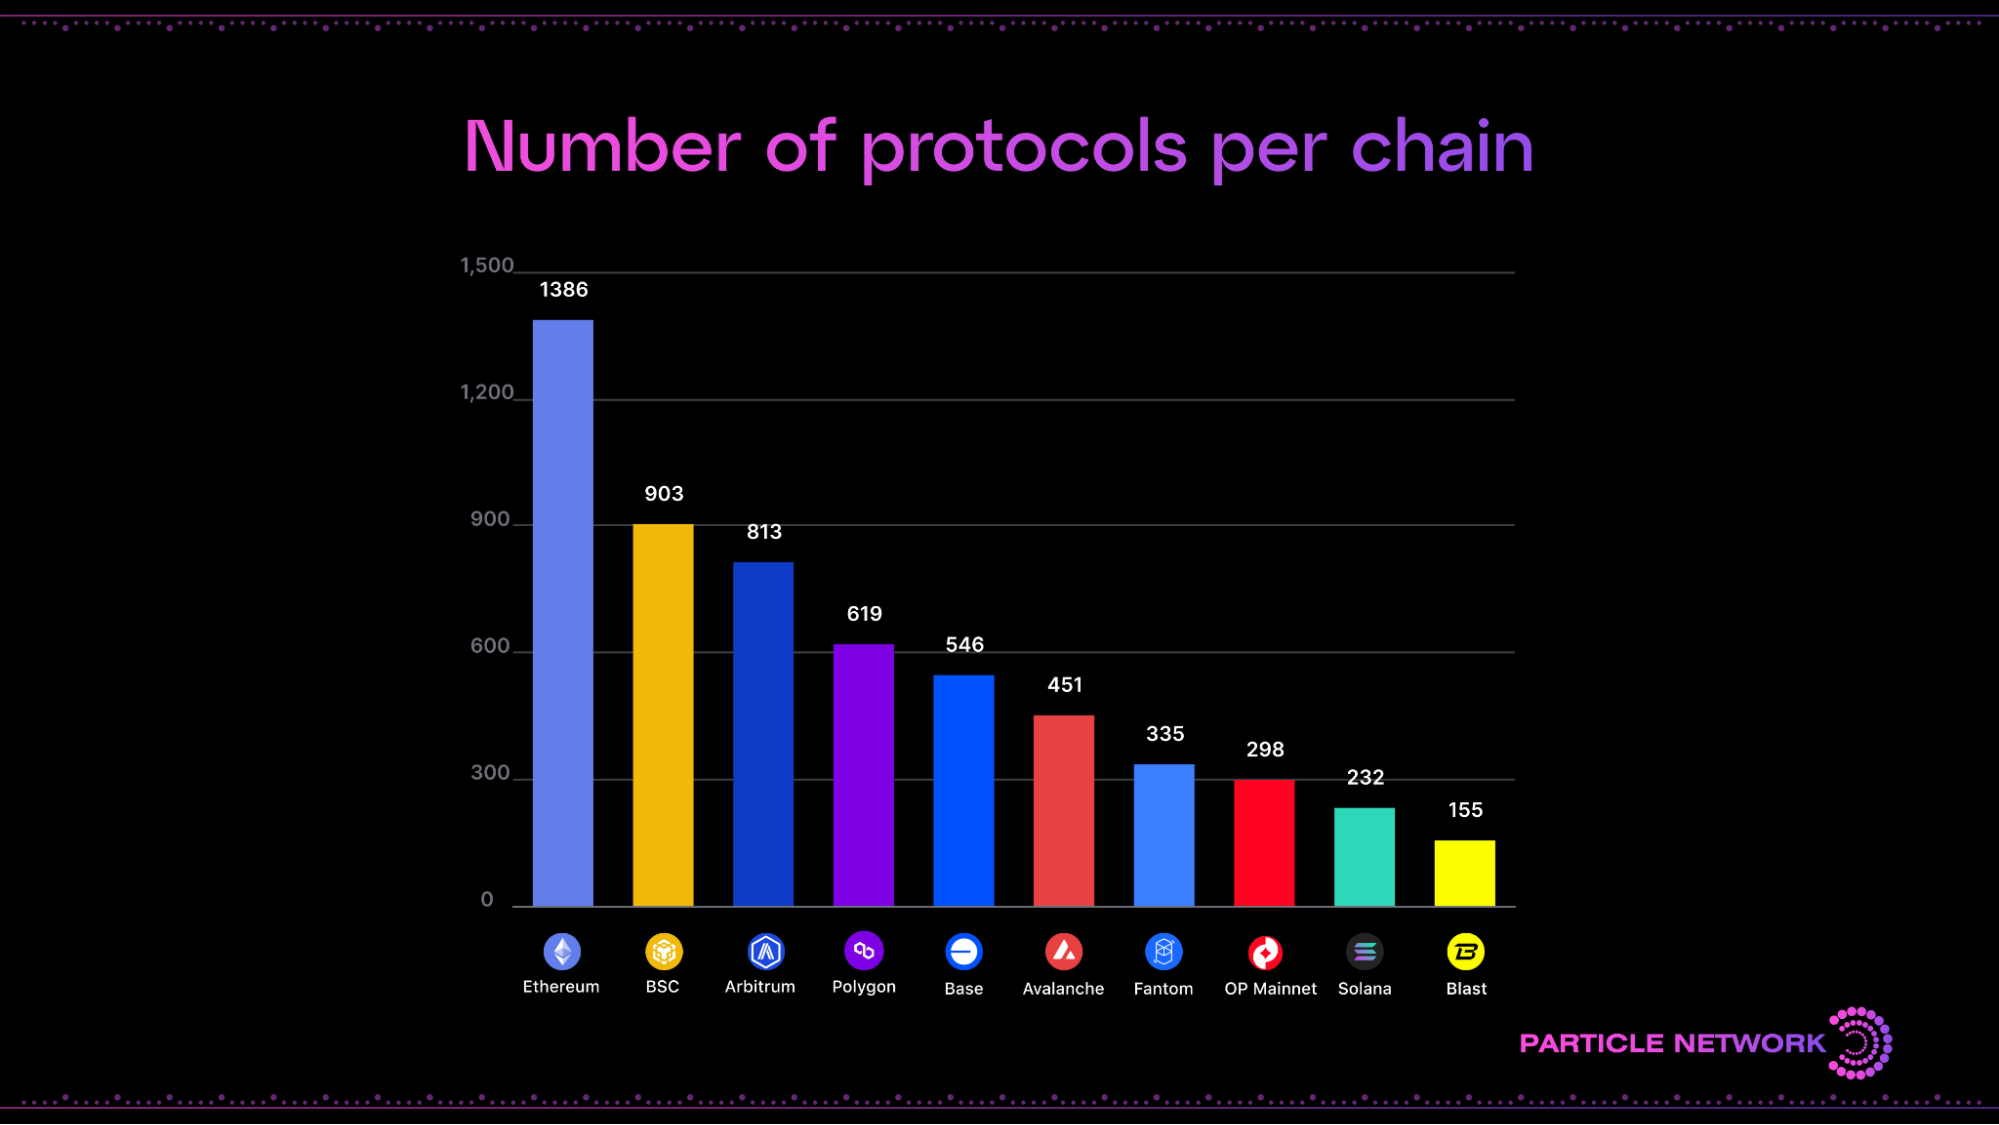
Fragmentation also breeds a landscape of analogous dApps in silos, leading to the need to maintain many versions. This doesn’t allow projects to compete globally, but only locally, and rewards side-stepping rather than competing. As such, as new chains appear, there is an endless need for:
- Decentralized exchanges
- Lending protocols
- Staking protocols
- Launchpads
- Futures exchanges
- NFT marketplaces
The success of some applications (X-to-Earn, games, DeFi, and prediction markets) shows that innovative use cases do bring in new users and even propagate to other ecosystems. But, until true abstraction arrives, copying and side-stepping will remain the norm, slowing the entire ecosystem down.
Assets
Just as users, dApps, and devs are fragmented, so are digital assets themselves. Tokens and NFTs do not freely transfer across all chains—in fact, much of the attractiveness of creating/building on a new chain spans from the ability to create new tokens, trends, and brands on it.
Some key examples of this are:
- Stablecoins: These essential assets exist on multiple chains, but two networks dominate their issuance. Ethereum and Tron host the lion’s share of stablecoin supply—about 59% and 35% respectively of all fiat-pegged stablecoins in circulation. This means USD liquidity is split mainly between different payment rails, and that $1 on one chain might not necessarily be worth $1 on another.
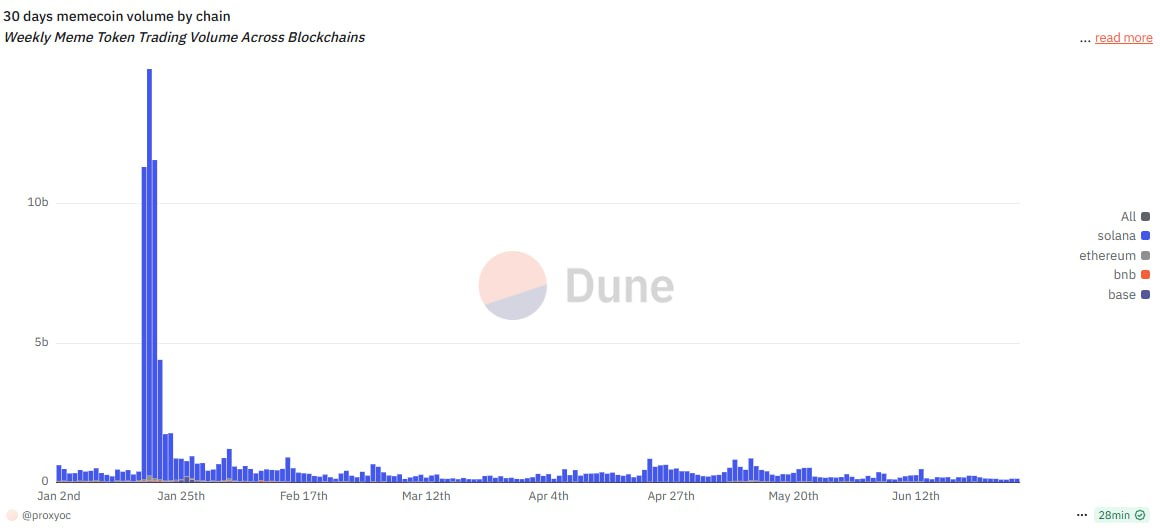
- Memes and their manias: A curious phenomenon observed through 2024’s meme explosion was the appearance of new ecosystems of memes to mimic Solana’s success. Ever since DOGE, every chain has aspired to have its own meme ecosystem, and this trend seems to be accentuating over time. Since the publication of our previous report, it has been clear that chains’ asset ecosystems are exclusive to themselves, or at least that’s how chain users perceive them.
- NFT collections are usually chain-exclusive, meaning users on any other chain are often sidelined from them (by design).
The above leads to—you guessed it right—more fragmentation.
The cross-chain factor
In our previous report, one of the greatest inefficiencies we marked was that of cross-chain bridging. And, over the last year, the industry has grown to rely more and more on bridging:
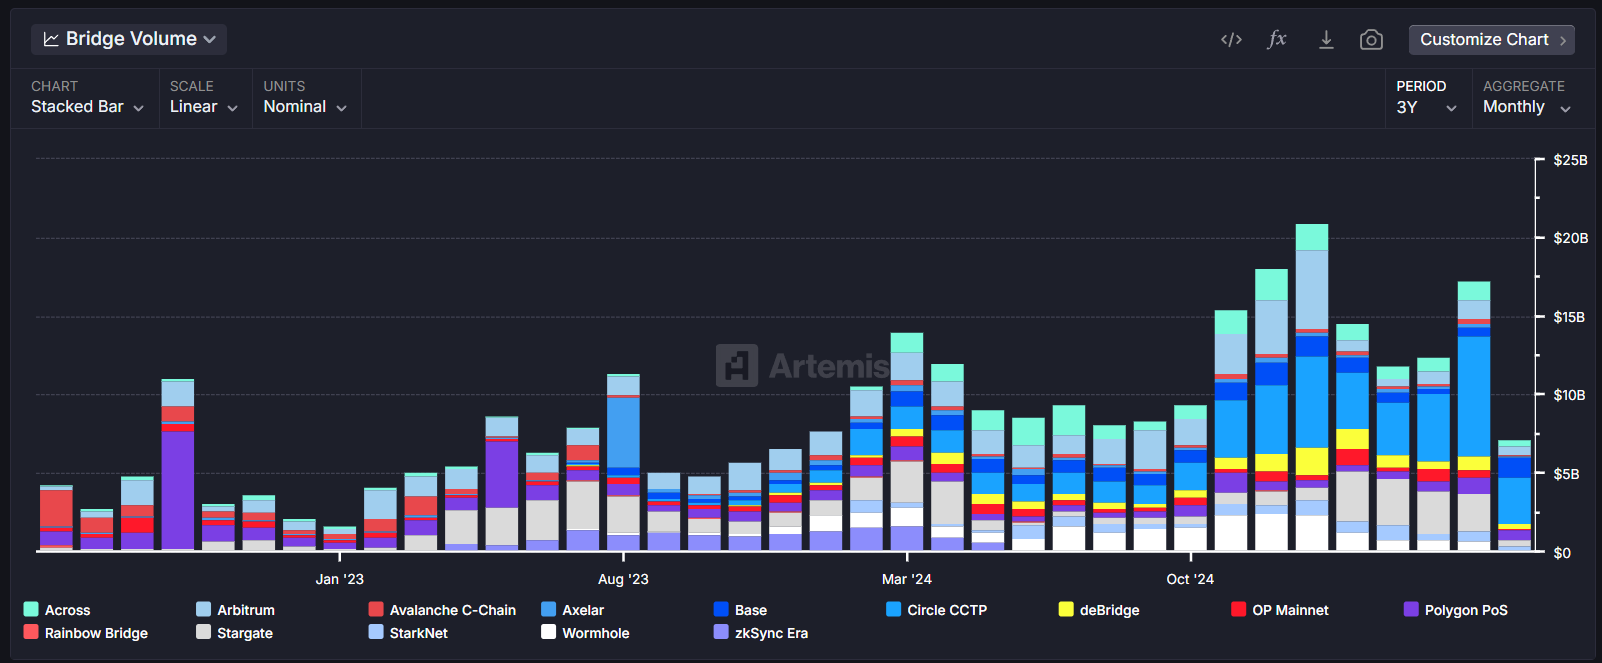
As the chart above shows, cross-chain bridge volume reached $17.3B in May, up 30% month-over-month as users hop between isolated liquidity pools. And, more impressively, from the previous bottom (Jan 23) to its peak (Jan 25), bridging volume has more than 10x’d.
Although this data isn’t conclusive—there is, after all, no way to know whether most bridging is manual or automated—the lack of chain-agnostic applications, alongside the growth of bridging, does point to an increase in fragmentation.
Furthermore, two additional factors suggest that bridges remain an inconvenience factor:
- A lingering dominance of native bridges, which are rarely used in automation.
- The concentration of bridging volume across 3-6 bridges at any given time, suggesting their usage solely to adapt to market conditions/opportunities amidst fragmentation. In other words, money flows where money is—and will easily and quickly flock anywhere.
The above suggests that many users are not maximalists of a single chain, and will migrate assets to wherever yields or opportunities are best. However, this fragmentation comes at the cost of new systemic risks (we all know what happens when bridges are exploited) as well as liquidity problems (e.g. a token might exist on 5 chains via bridges, but deep liquidity for it might only be on one or two chains, limiting its usefulness).
And yes, it’s happening faster than ever, increasing the reliance on bridges.
Ok, so fragmentation is growing. Now what?
We can continue expanding the above demonstration of fragmentation's growth nearly endlessly. Every area we examined, from daily active users and TVL, to developer counts, bridge flows, etc., reinforces the picture of an ecosystem that has exploded outward into multiple islands. And wherever we look, this only seems to confirm itself.
As such, looking ahead, the true question is whether chain abstraction solutions can arrive fast enough. We continue to pose chain abstraction (in practice, anything that achieves a user experience devoid of the manual steps required to interact with multiple chains) as the solution to this problem since:
- As fragmentation expands, it becomes increasingly unlikely that the entire ecosystem will settle on a single blockchain and abandon all others, at least in the short term.
- ChA can be achieved via so many different approaches (blockchain-level, account-level, and orchestration) that it’s a flexible enough concept to encompass all scenarios where fragmentation is a problem.
The question then becomes more precise: how fast can ChA fully arrive?
The answer to this is determined by four factors:
The failing rate of existing chains (and de-fragmentation of their liquidity)
Currently, this trend is accelerating, particularly as incentives dry out.
Our prediction? Over time, we’re betting that more and more chains will fail—simply because there will be too many of them, and some will succeed in achieving network effects.
As such, it will become increasingly risky to launch a new chain, although not to the point where the number of chains decreases. There will always be new chains, it will just be harder to launch them successfully.
The rate of creation of new chains, and their value accumulation
Current trends suggest that the total number of chains will continue to increase, but value metrics will remain unpredictable. Like HyperEVM in 2025, some blockchains could rise seemingly out of nowhere, but this should continue to be the exception.
Our prediction? This won’t stop. Value accumulation will continue to happen but, through one framework or another, there won’t be fewer chains. In this regard, it’s chain abstraction or nothing. Meanwhile, when it comes to value, the top chains (particularly in terms of security and decentralization) will continue to reign. As such, there will always be a cap on how much money is locked within these chains, regardless of what goes on around them.
The chains encompassed by diverse chain abstraction solutions
This one’s still a great incognita.
Currently, only a handful of ChA solutions (with Universal Accounts leading the pack) can be generalized. However, all working solutions (Universal Accounts, OneBalance, Arcana) act at the account level, meaning they need to be integrated within dApps.
The industry still needs to produce solutions at the blockchain and orchestration level to fill several gaps. However, we remain bullish on ChA, as every achievement in this regard will lead to exponential improvements—particulary as abstracted ecosystems become abstracted in relation to each other.
Our prediction? Chain abstraction grows exponentially, although it will never fully catch up to chains’ creation. There will be a “sweet spot” where most of the ecosystem will feel abstracted and ChA’s effect will be noticeable, as well as a “near total-abstraction point” where the only factor stopping ChA from being ever-present will be that new chains are appearing faster—but this gap will become more and more narrow as new chains are born within abstracted frameworks.
Along the way, we also expect ChA adoption to accelerate through:
- The adoption of standards like EIP-7702, which creates a lot more flexibility for abstraction protocols.
- The first break of abstracted dApps into the mainstream, leading other dApps to realize the power of this value proposition and skewing consumers’ preferences towards a better UX.
- The natural expansion of these solutions.
And so, overall, we expect chain abstraction, through all of the above factors, to follow the below trajectory:
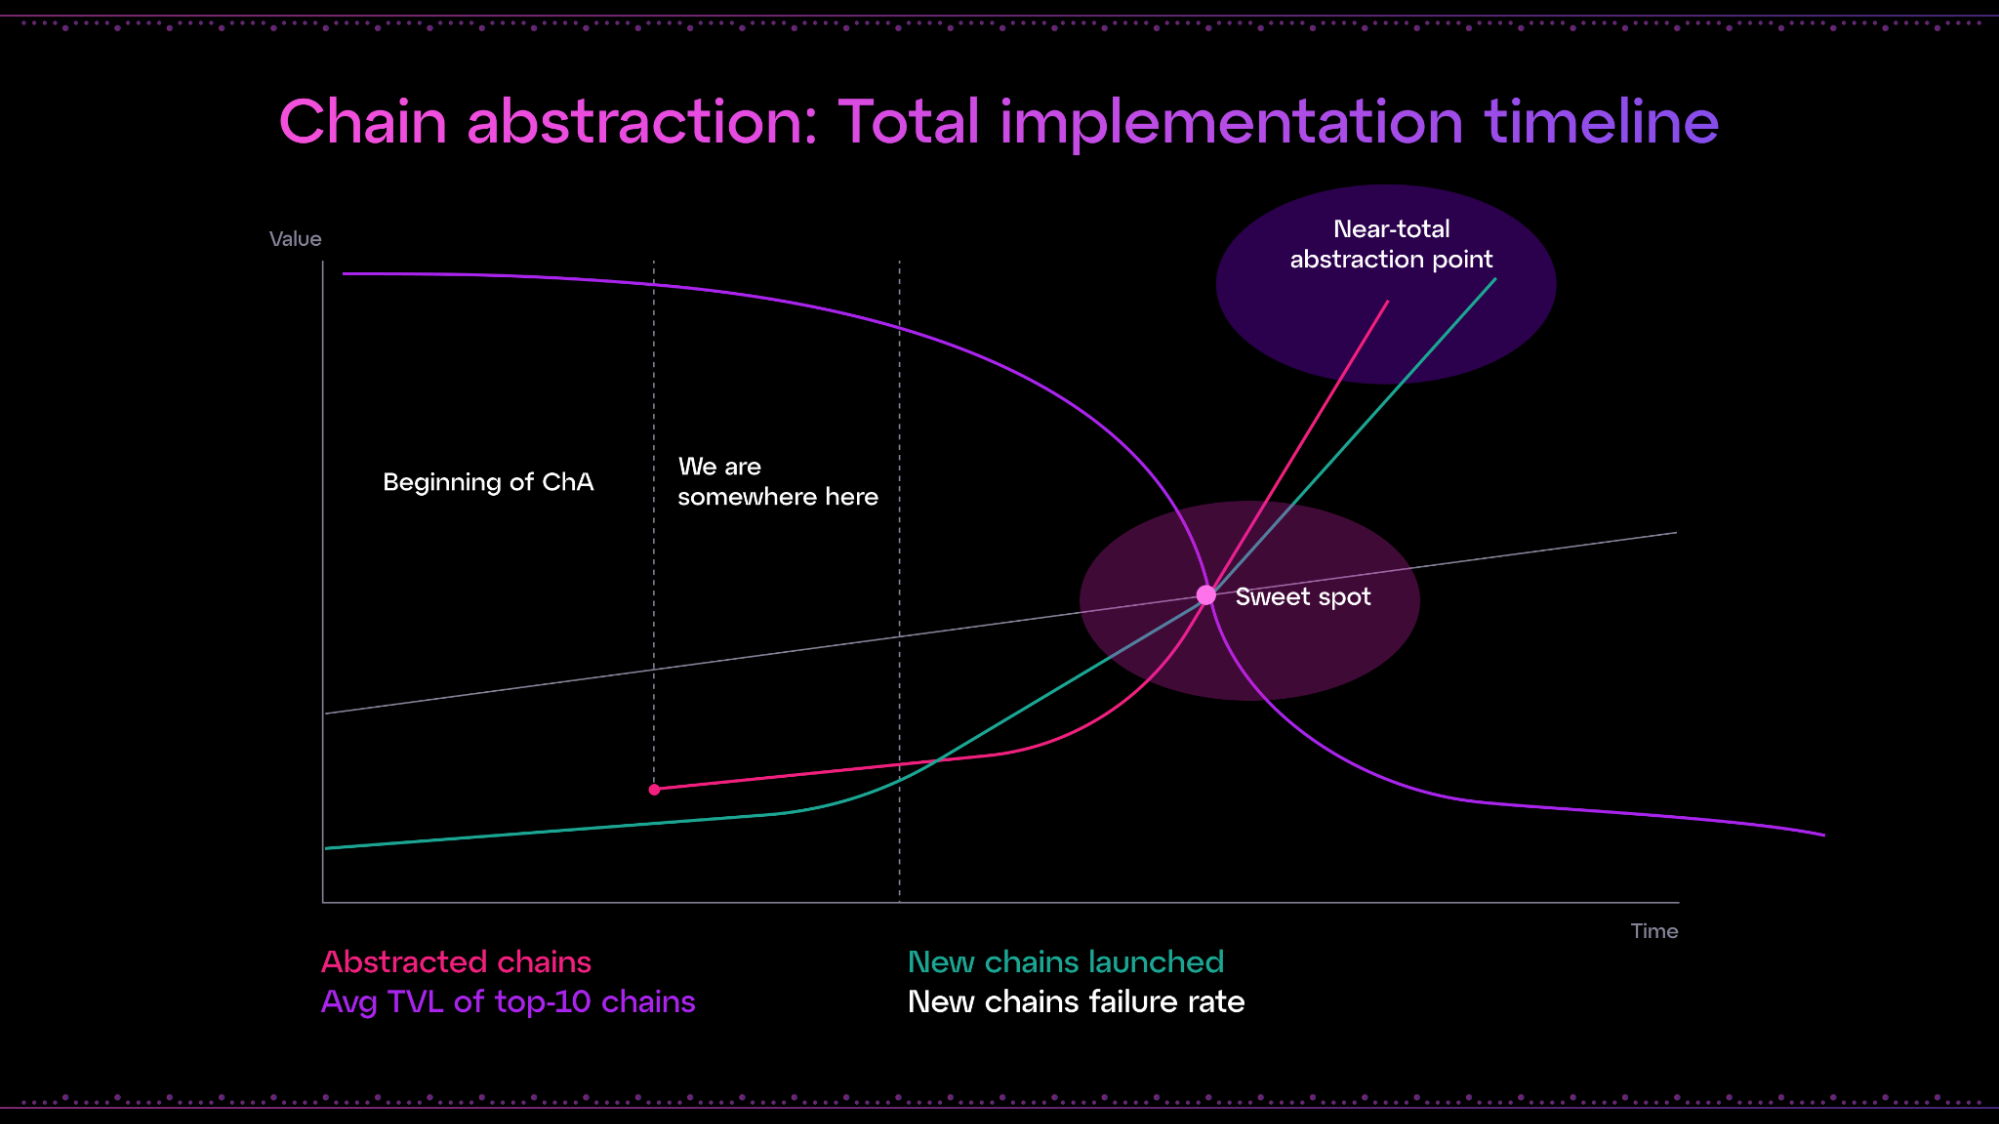
This chart illustrates two core moments in chain abstraction’s projected path:
- The “sweet spot”, when, amidst the accelerating race between fragmentation and abstraction, and through a compounding wave of chain failures, new launches, and abstracted networks, the ecosystem begins to “feel” abstracted.
- Web3’s final state, where abstraction is the norm and fragmentation is only inches forward of it.
Fragmentation will never be truly gone, but it won’t be felt by end users. At least not where it counts—that’s the promise of chain abstraction.
Particle Network's Chain Abstraction solutions are 100% free for developers and teams. By integrating them, you can set your project in a path to leveraging chain abstraction.
About Particle Network
Particle Network powers chain abstraction, addressing Web3's fragmentation of users and liquidity. This is enabled by Particle's Universal Accounts, which give users a unified account and balance across all chains.
Share this article
About the author(s)
